Optimal 6G Transmitter Placement in Realistic Urban Environments
Lukas Taus, Yen-Hsi Richard Tsai, Jeffrey G. Andrews
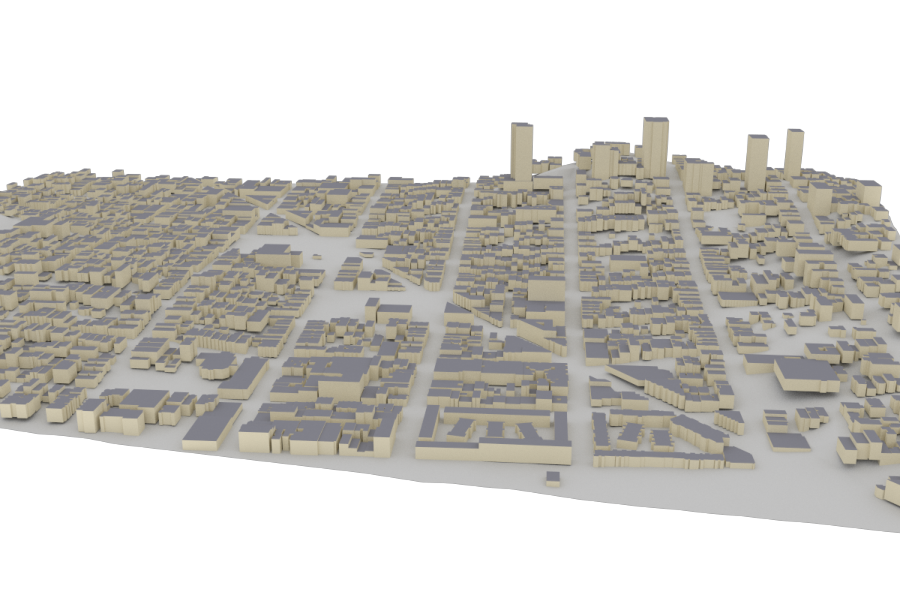
High-fidelity 3D model of San Francisco used for ray-tracing simulations.
High-fidelity 3D model of San Francisco used for ray-tracing simulations.
Imagine you are a telecom engineer tasked with placing a handful of wireless towers across a dense city like San Francisco. Where should they go? Place them poorly and whole neighborhoods lose signal; place them naively and towers drown each other out with interference. This project answers that question with mathematics.
We develop a rigorous framework that treats the tower placement problem as a mathematical optimization. Using physics-accurate ray tracing, we simulate exactly how radio signals bounce off real buildings, diffract over rooftops, and scatter through glass and concrete. On top of this realistic propagation model, we prove that our objective has a special mathematical property called submodularity — a diminishing-returns structure that guarantees our greedy placement algorithm (IA-SPA) always finds a solution within a provable factor of optimal.
Tested against the real-world tower deployments of AT&T and T-Mobile in San Francisco, IA-SPA achieves up to 70% higher mean data rates and slightly improved interference levels (2% lower interference) using the same number of towers.
Standard placement heuristics often rely on simplified "disk" models. Our method utilizes Sionna RT to perform site-specific ray tracing. This accounts for:
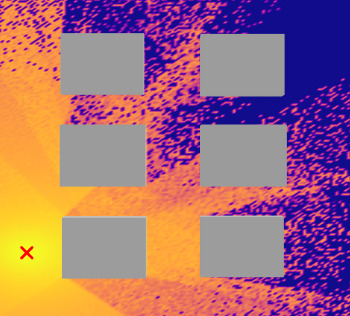
The figure on the right illustrates ray-traced signal propagation in an urban environment. Each colored path represents a signal ray bouncing between buildings, capturing the complexity that simple disk models miss entirely.
We consider the problem of optimally placing a set of transmitters \(T = \{t_1, \dots, t_n\} \subset \Omega\) in a physical environment \(\Omega \subseteq \mathbb{R}^n\), where signal propagation is governed by a spatially varying medium \(\mu(x)\). Each location \(y \in \Omega\) receives signal contributions from all transmitters through a propagation model \(P(y,x)\). A natural performance measure is the Signal-to-Interference-and-Noise Ratio (SINR):
\[ \text{SINR}(y, T) = \frac{\max_{t \in T} P(y, t)} {\sum_{t \in T} P(y, t) - \max_{t \in T} P(y, t) + \sigma^2} \]
While physically accurate, this formulation induces a non-convex optimization landscape with many local optima. To overcome this, we introduce a family of aggregated surrogate measures \(\mathcal{P}_{\text{MAX}}\) and \(\mathcal{P}_{\text{SUM}}\), and define a spatially aggregated objective functional:
\[ \mathcal{S}(T) = \mathbb{E}_{Y \sim f}\left[\bar{W}(\mathcal{P}(Y, T))\right] \]
where \(f(y)\) is a spatial density encoding region importance and \(\bar{W}(\kappa) = \int_0^\kappa w(s)\,ds\) is the anti-derivative of a monotone utility function \(w\). We formulate two equivalent placement problems:
\[ \min_{T \subseteq \Omega} |T| \quad \text{s.t.} \quad \mathcal{S}(T) \geq \beta \qquad \text{or} \qquad \max_{T \subseteq \Omega} \mathcal{S}(T) \quad \text{s.t.} \quad |T| \leq \beta. \]
Placement isn't just about coverage — it's about managing interference. IA-SPA specifically targets areas where the SINR is lowest, ensuring robust "edge-of-cell" performance for every user in the network.
To establish a realistic baseline, we utilized building footprint data and existing tower locations for AT&T and T-Mobile sourced from open-source network datasets. This allows us to compare IA-SPA directly against real-world engineering deployments in a dense 3D environment.
High-fidelity 3D model of San Francisco used for ray-tracing simulations.
The table below summarizes performance of IA-SPA compared to existing carrier deployments using the same number of towers.
| AT&T Scenario | T-Mobile Scenario | |||||
|---|---|---|---|---|---|---|
| Metric | Reference | IA-SPA | Change | Reference | IA-SPA | Change |
| Throughput [MBps] | ||||||
| Mean Rate | 21.17 | 36.12 | +70.62% | 10.06 | 31.72 | +215.49% |
| Edge Rate (5th pct.) | 3.57 | 8.38 | +134.58% | 1.11 | 9.55 | +758.39% |
| Interference [nW] | ||||||
| Mean Interference | 2.24 | 2.19 | −2.04% | 17.54 | 1.11 | −93.70% |
| Max Interference | 495.86 | 473.93 | −4.42% | 20491.9 | 214.04 | −98.96% |
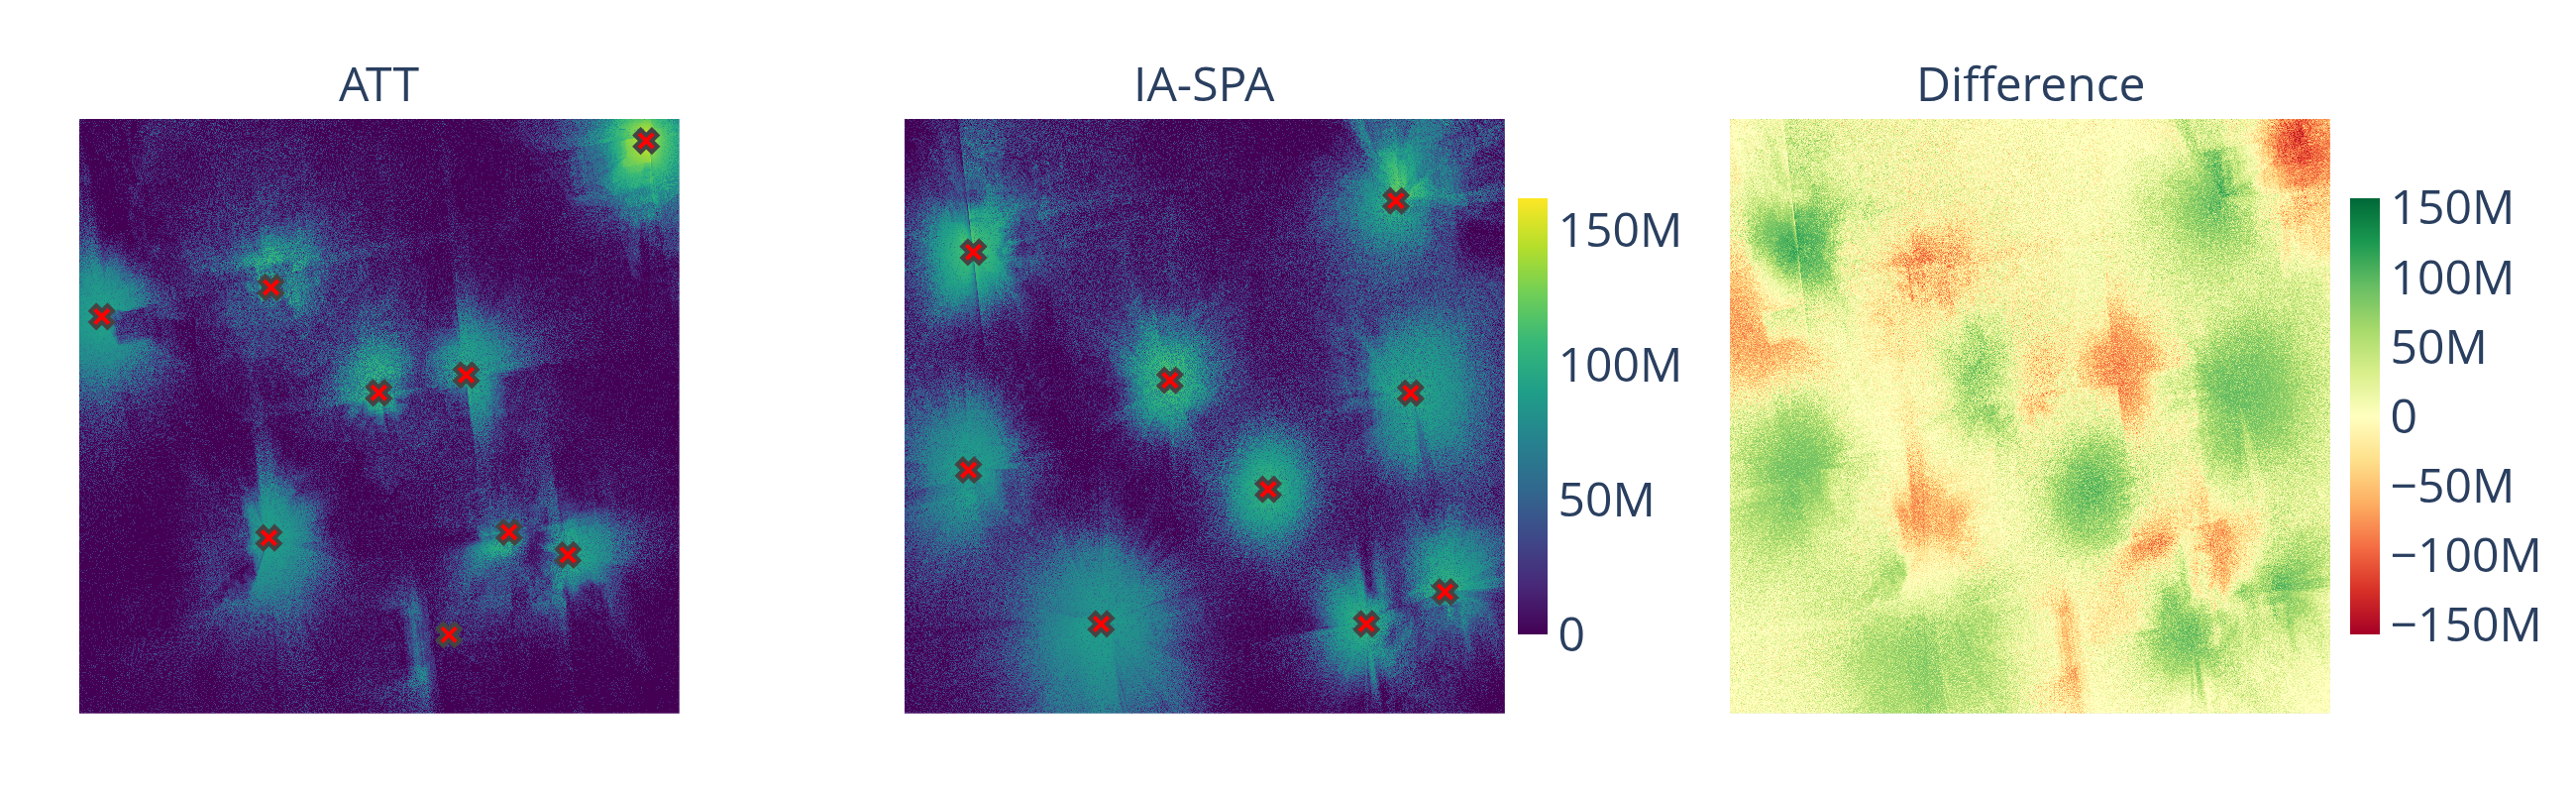
Data rate coverage maps: AT&T baseline (left) vs. IA-SPA optimized placement (right) in San Francisco.
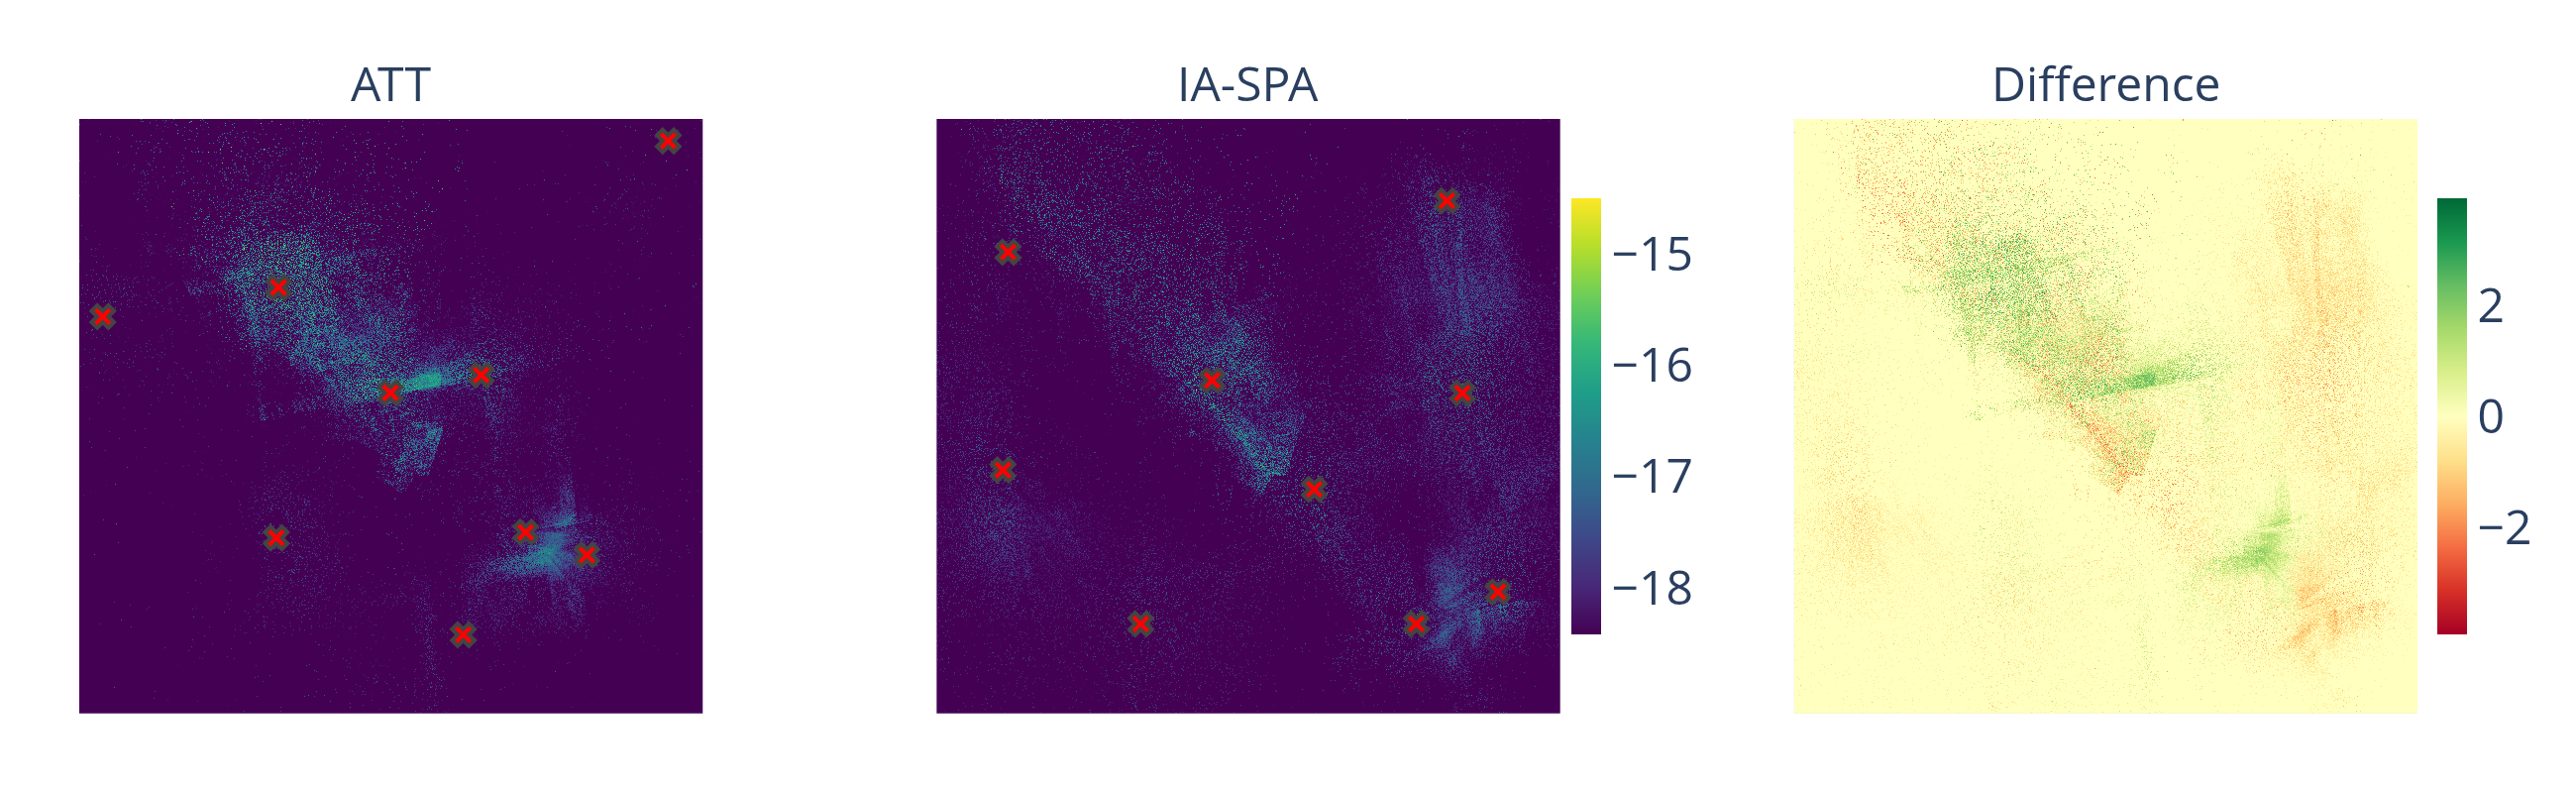
Interference maps: AT&T baseline (left) vs. IA-SPA optimized placement (right). IA-SPA dramatically reduces peak interference.
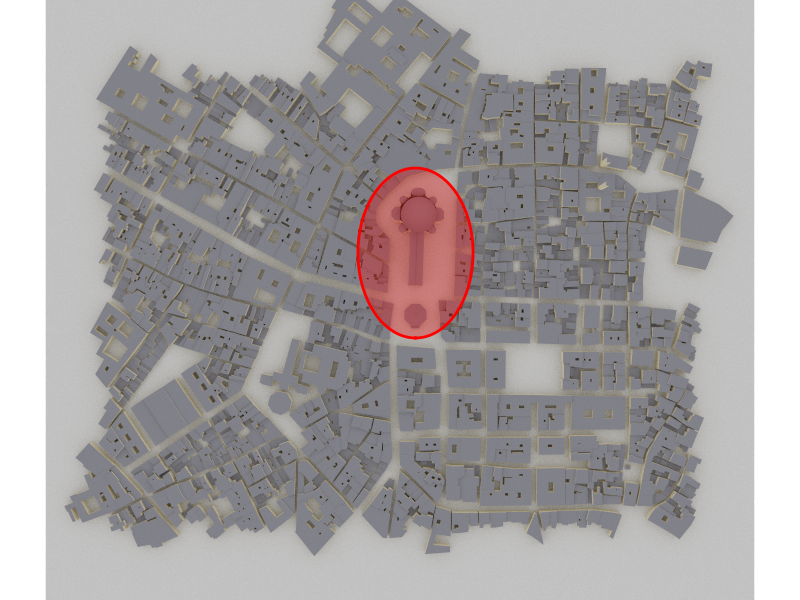
For Florence, we demonstrate IA-SPA's ability to handle exclusionary zones — historical landmarks where tower placement is prohibited.
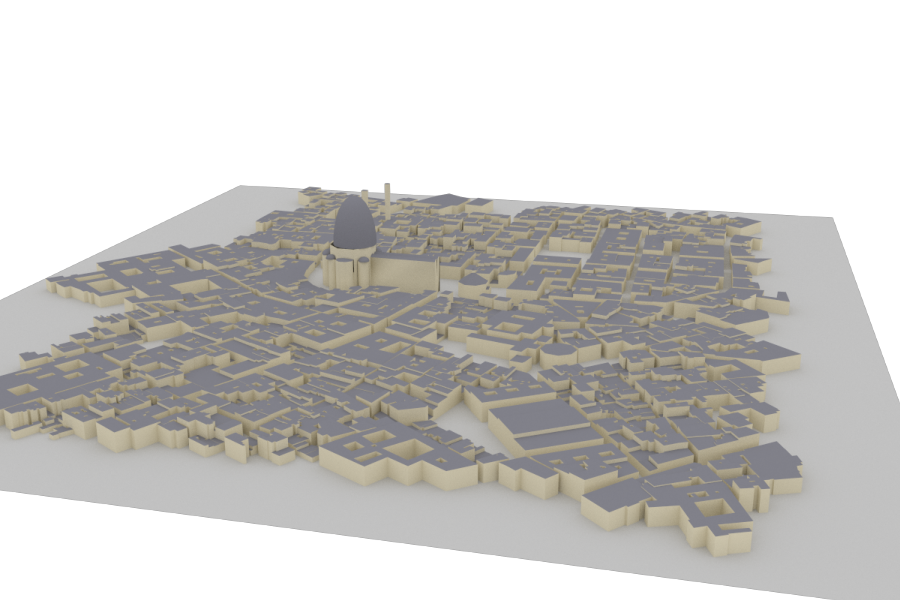
High-fidelity 3D model of Florence used for ray-tracing simulations.
Exclusionary zone (red) where tower placement is prohibited.
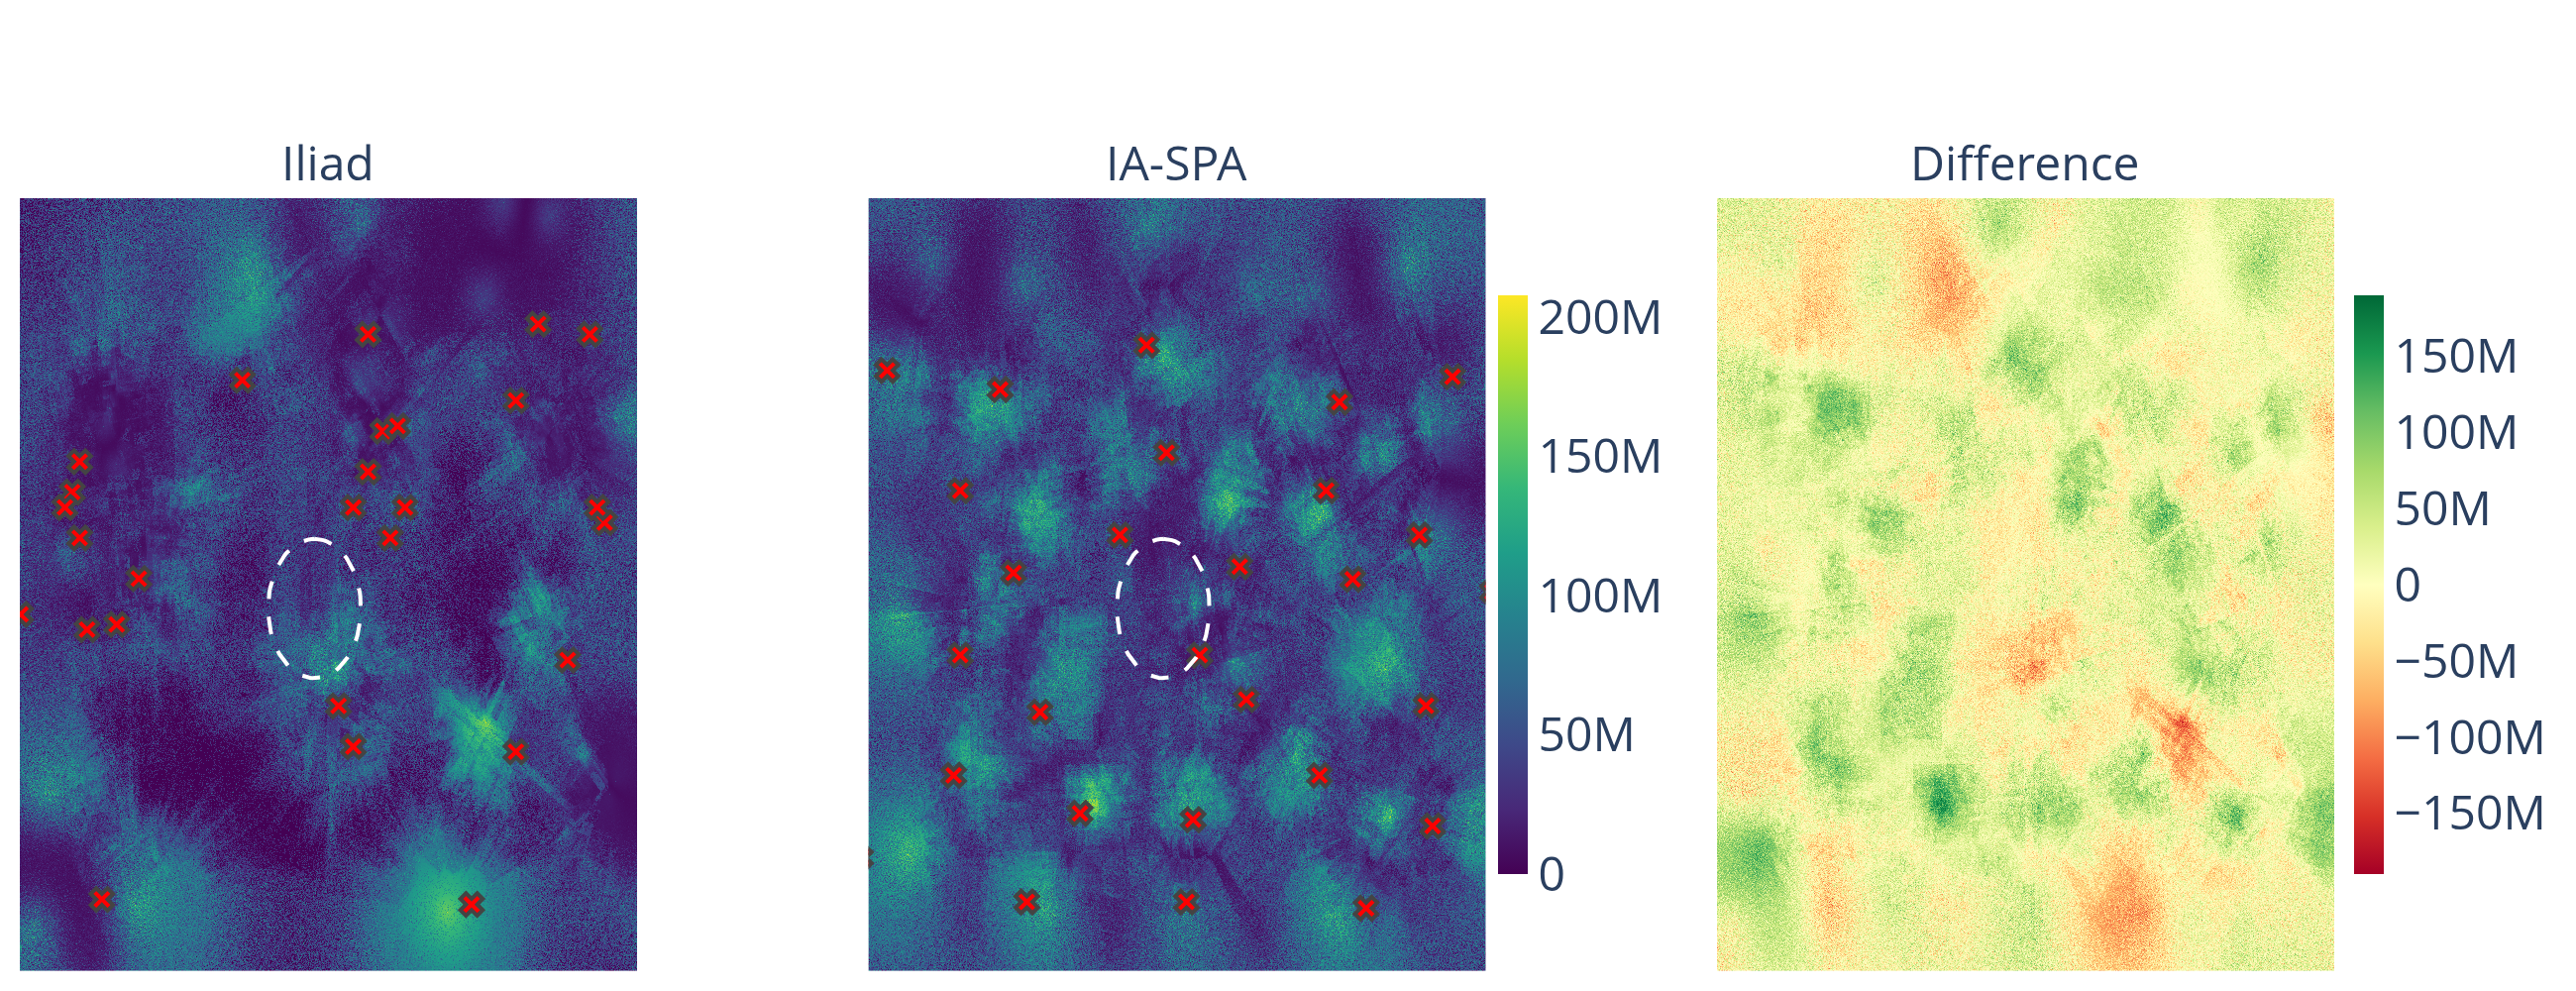
Data rate coverage with exclusionary zone: Iliad baseline (left) vs. IA-SPA (right).
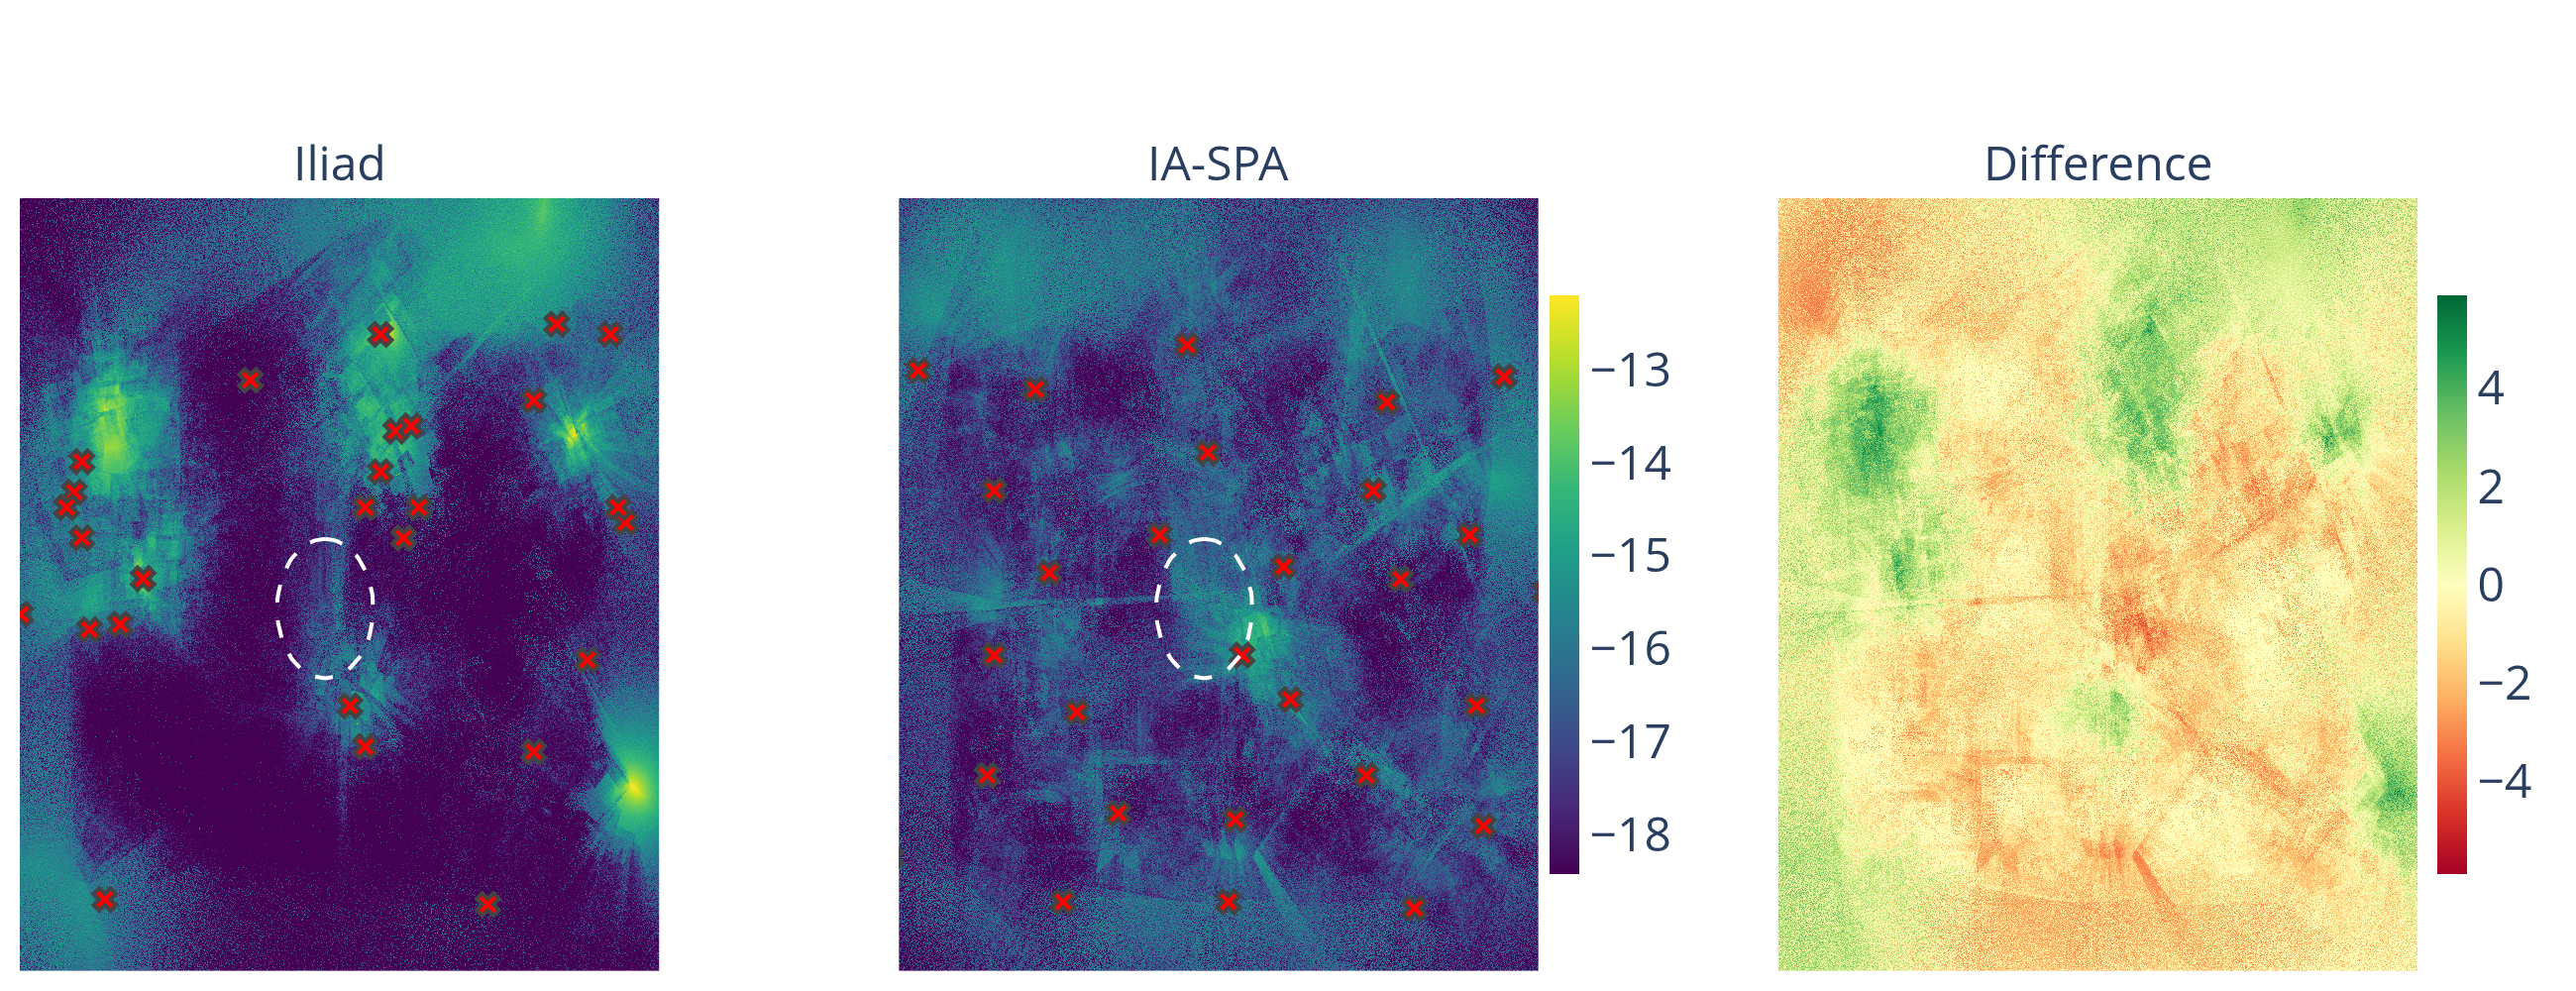
Interference maps with exclusionary zone: Iliad baseline (left) vs. IA-SPA (right).
In practice, transmitters are rarely deployed in empty environments without existing infrastructure. Instead, operators typically face a continuous deployment setting, where new transmitters must be placed to augment an existing network. To evaluate IA-SPA in this more realistic scenario, we initialize the system with the 9 transmitter locations deployed in San Francisco by AT&T. Starting from this baseline, IA-SPA sequentially determines up to 5 additional transmitter locations to improve network coverage. We assess performance by comparing against random transmitter placement, reporting results averaged over 10 independent trials to reduce variability due to randomness.
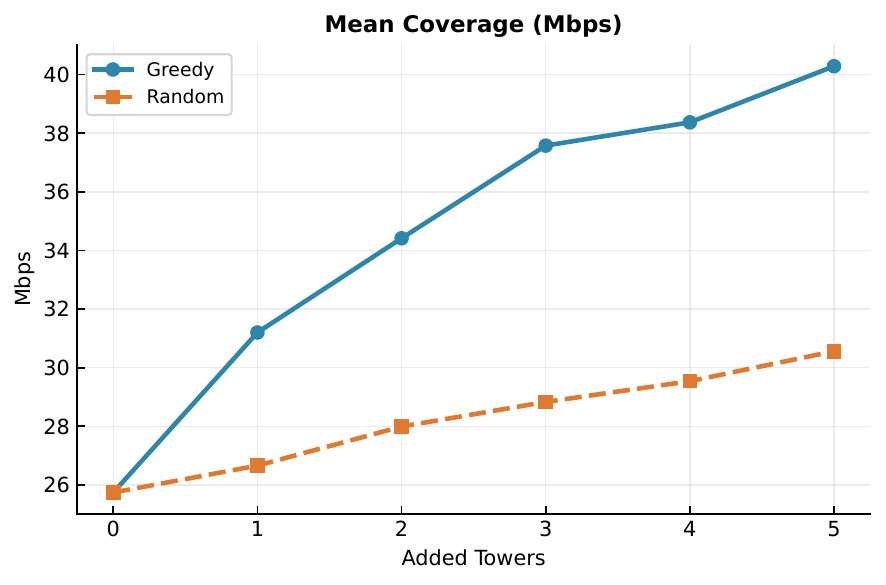
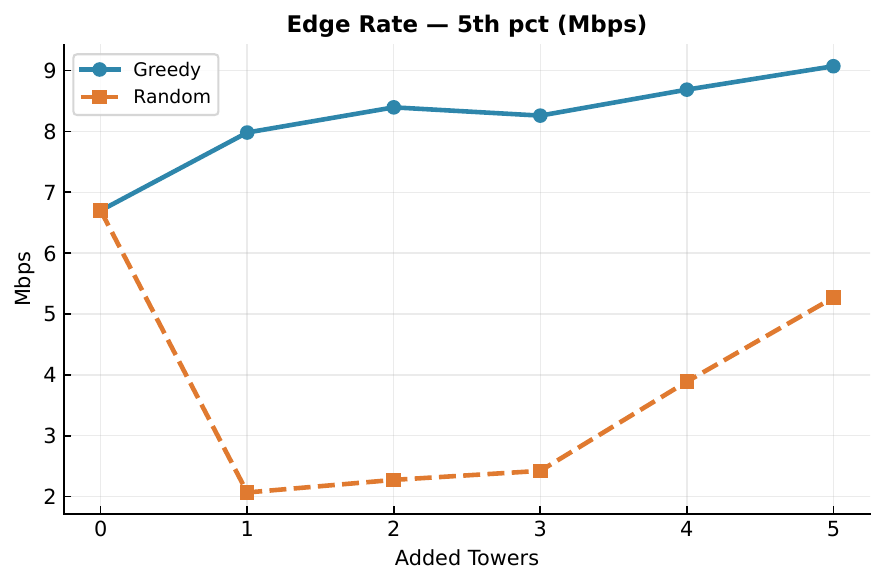
Comparison of IA-SPA against the mean performance over 10 trials of random transmitter placement. The x-axis indicates the number of additional towers placed on top of the 9 existing AT&T towers in San Francisco. (Left) Average data rate achieved by each method. (Right) Edge rate performance measured at the 5th percentile.
The left plot shows the average data rate as a function of the number of added transmitters. The blue curve corresponds to IA-SPA, while the orange curve shows the mean performance of random placement. Even with the addition of a single transmitter, IA-SPA yields a substantial improvement over random placement. The right plot presents the same comparison for the edge rate (5th percentile) — the performance experienced by the worst-served users in the network. IA-SPA again consistently outperforms random placement, with significant gains observed even when only a single transmitter is added. This highlights the algorithm's ability to identify high-impact locations rather than relying on chance.