Optimal 6G Transmitter Placement in Realistic Urban Environments
Lukas Taus, Yen-Hsi Richard Tsai, Jeffrey G. Andrews
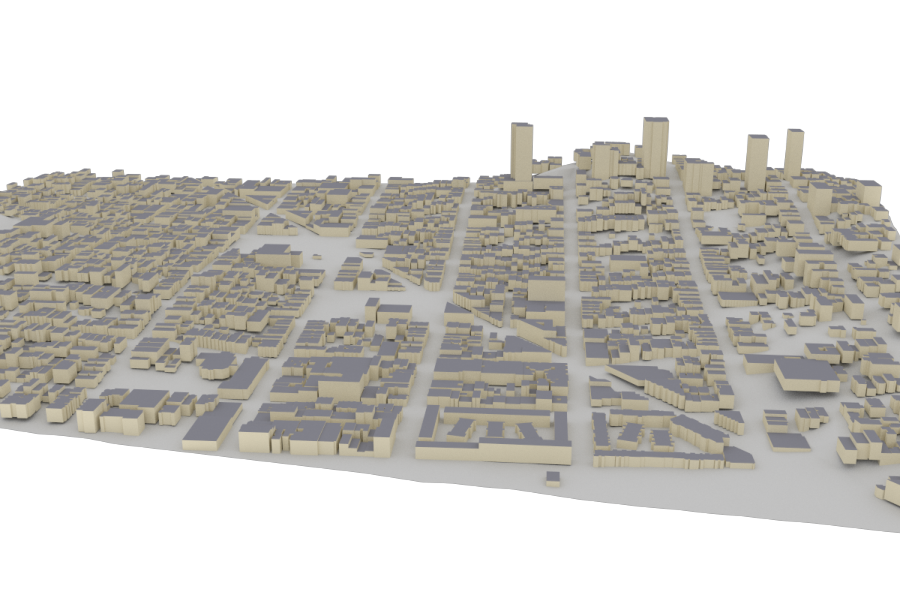
High-fidelity 3D model of San Francisco used for ray-tracing simulations.
High-fidelity 3D model of San Francisco used for ray-tracing simulations.
Imagine you are a telecom engineer tasked with placing a handful of wireless towers across a dense city like San Francisco. Where should they go? Place them poorly and whole neighborhoods lose signal; place them naively and towers drown each other out with interference. This project answers that question with mathematics.
We develop a rigorous framework that treats the tower placement problem as a mathematical optimization. Using physics-based ray tracing on detailed 3D city models, we simulate how radio signals propagate around real buildings, including multipath and blockage. On top of this site-specific propagation model, we prove that our objective has a special mathematical property called submodularity — a diminishing-returns structure that gives our greedy placement algorithm (IA-SPA) a provable approximation guarantee relative to the optimum of this objective.
Tested against real-world tower deployments with the same number of towers, IA-SPA raises the mean data rate by 70% over AT&T's network and by 215% over T-Mobile's in San Francisco, and the edge rate (the 5th-percentile rate over covered locations) by 88% and 758%, while also lowering mean interference. In Florence, it improves on the Iliad network by 27–30% in mean data rate even with protected historic areas off-limits. In San Francisco the gains over AT&T hold up under fading and modeling errors, and in both cities IA-SPA outperforms random placement when towers are added to an existing network.
Standard placement heuristics often rely on simplified line-of-sight models, which classify locations as covered or blocked, sometimes with a distance-based path-loss law. Such models do not capture energy arriving along indirect paths. Our method instead uses Sionna RT to perform site-specific ray tracing, which:
The optimization framework itself is not tied to ray tracing: it works with any propagation model that provides the received-power field \(P(y,x)\).
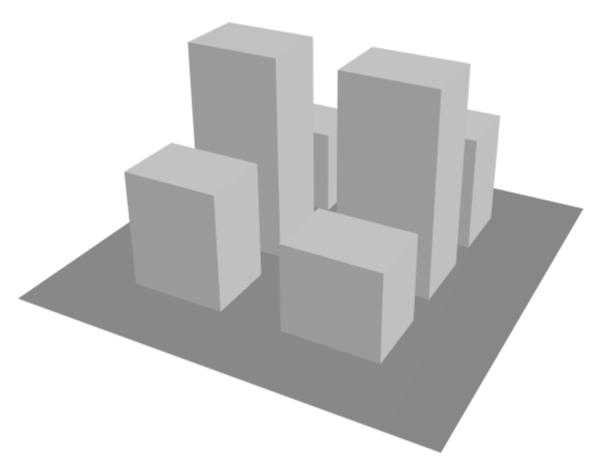

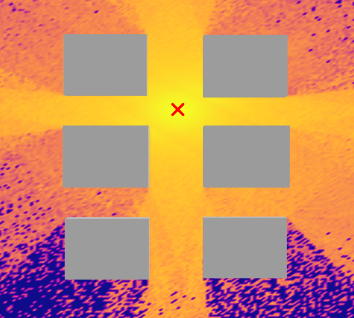
A toy urban scene, shown as a 3D view, a top-down view, and the achievable-rate field produced by a single transmitter (red marker), computed from the site-specific propagation field \(P(y,x)\). The buildings block and redirect the signal in ways that line-of-sight and distance-based models cannot capture.
We consider the problem of optimally placing a set of transmitters \(T = \{t_1, \dots, t_n\} \subset \Omega\) in a physical environment \(\Omega \subseteq \mathbb{R}^n\), where signal propagation is governed by a spatially varying medium \(\mu(x)\). Each location \(y \in \Omega\) receives signal contributions from all transmitters through a propagation model \(P(y,x)\). A natural performance measure is the Signal-to-Interference-and-Noise Ratio (SINR):
\[ \text{SINR}(y, T) = \frac{\max_{t \in T} P(y, t)} {\sum_{t \in T} P(y, t) - \max_{t \in T} P(y, t) + \sigma^2} \]
Directly optimizing the SINR over transmitter locations is a difficult non-convex subset-selection problem. To make it tractable, we introduce two aggregated surrogate measures: \(\mathcal{P}_{\text{MAX}}(y,T) = \max_{x \in T} P(y,x)\), the strongest received signal (the SINR numerator, ignoring interference), and \(\mathcal{P}_{\text{SUM}}(y,T) = \sum_{x \in T} P(y,x)\), the total received power. From either one we define a spatially aggregated objective functional:
\[ \mathcal{S}(T) = \mathbb{E}_{Y \sim f}\left[\bar{W}(\mathcal{P}(Y, T))\right] \]
where \(f(y)\) is a spatial density weighting receiver locations (it can be read as the probability density of user locations), and \(\bar{W}(\kappa) = \int_0^\kappa w(s)\,ds\) is the anti-derivative of a weight function \(w\) that gives the marginal utility of network quality \(\kappa\). Restricting transmitters to a feasible set of candidate sites \(\mathcal{X}\), two natural resource-constrained formulations are to minimize the number of transmitters needed to reach a prescribed utility level, or to maximize utility under a budget:
\[ \min_{T \subseteq \mathcal{X}} |T| \quad \text{s.t.} \quad \mathcal{S}(T) \geq \beta \qquad \text{or} \qquad \max_{T \subseteq \mathcal{X}} \mathcal{S}(T) \quad \text{s.t.} \quad |T| \leq \beta. \]
IA-SPA builds the deployment one transmitter at a time, each time choosing a site whose marginal gain in \(\mathcal{S}\) is within a factor \((1-\varepsilon)\) of the best available. Because \(\bar{W}\) is concave, an equal increase in aggregated received power is worth more in poorly served regions than in well-served ones, so the algorithm favors strengthening weak areas over piling more signal onto strong ones. Performance is then evaluated with the full SINR, including interference.
The same algorithm covers several practical settings: with no existing transmitters it designs a network from scratch; with \(T_{\text{fixed}}\) set to an operator's current towers it chooses where to add new ones; and prohibited areas (for example, protected historic sites) are handled simply by removing their candidate sites from \(\mathcal{X}\).
We use the 3D model of San Francisco included with Sionna (shown at the top of this page). The reference deployments are built from transmitter coordinates reported by the City and County of San Francisco's open-data portal and the OpenCellID database: 9 AT&T and 7 T-Mobile transmitters. This allows us to compare IA-SPA directly against real-world engineering deployments.
The table below compares IA-SPA with each carrier's deployment using the same number of towers. The edge rate is the 5th percentile of the data rate over covered receiver locations, a measure of what the worst-served users experience. All statistics are averaged over receiver heights of 1.5, 5, 10, and 20 m.
| AT&T Scenario | T-Mobile Scenario | |||||
|---|---|---|---|---|---|---|
| Metric | Reference | IA-SPA | Change | Reference | IA-SPA | Change |
| Data Rate [Mbps] | ||||||
| Mean Rate | 21.18 | 36.10 | +70.4% | 10.06 | 31.72 | +215.5% |
| Edge Rate (5th pct.) | 5.51 | 10.36 | +88.0% | 1.11 | 9.55 | +758.4% |
| Interference [nW] | ||||||
| Mean Interference | 2.24 | 2.19 | −2.0% | 17.54 | 1.11 | −93.7% |
| Max Interference | 495.86 | 473.93 | −4.4% | 20491.9 | 214.04 | −99.0% |
The throughput gains do not come from simply turning up useful signal at the cost of more interference: mean interference also drops, slightly against AT&T and by 94% against T-Mobile. The maximum data rate is somewhat lower with IA-SPA in both comparisons; this is not a contradiction, since the maximum is set by a single receiver location and can be dominated by an isolated high-SINR spot, while the mean and edge rates reflect performance across the whole city.
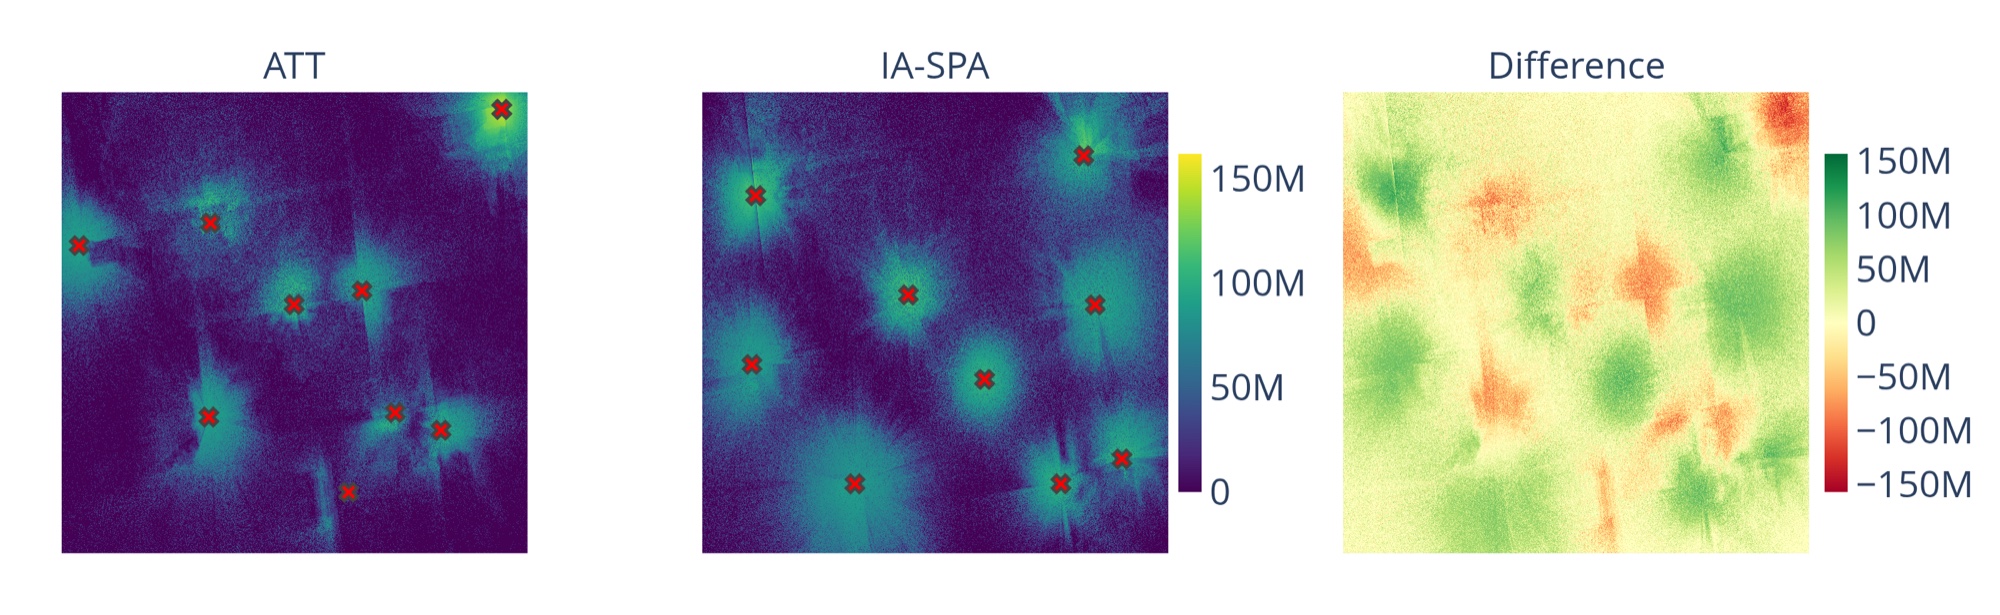
Data rate across San Francisco: AT&T reference deployment (left), IA-SPA deployment (center), and the difference (right). Red crosses mark transmitter locations.
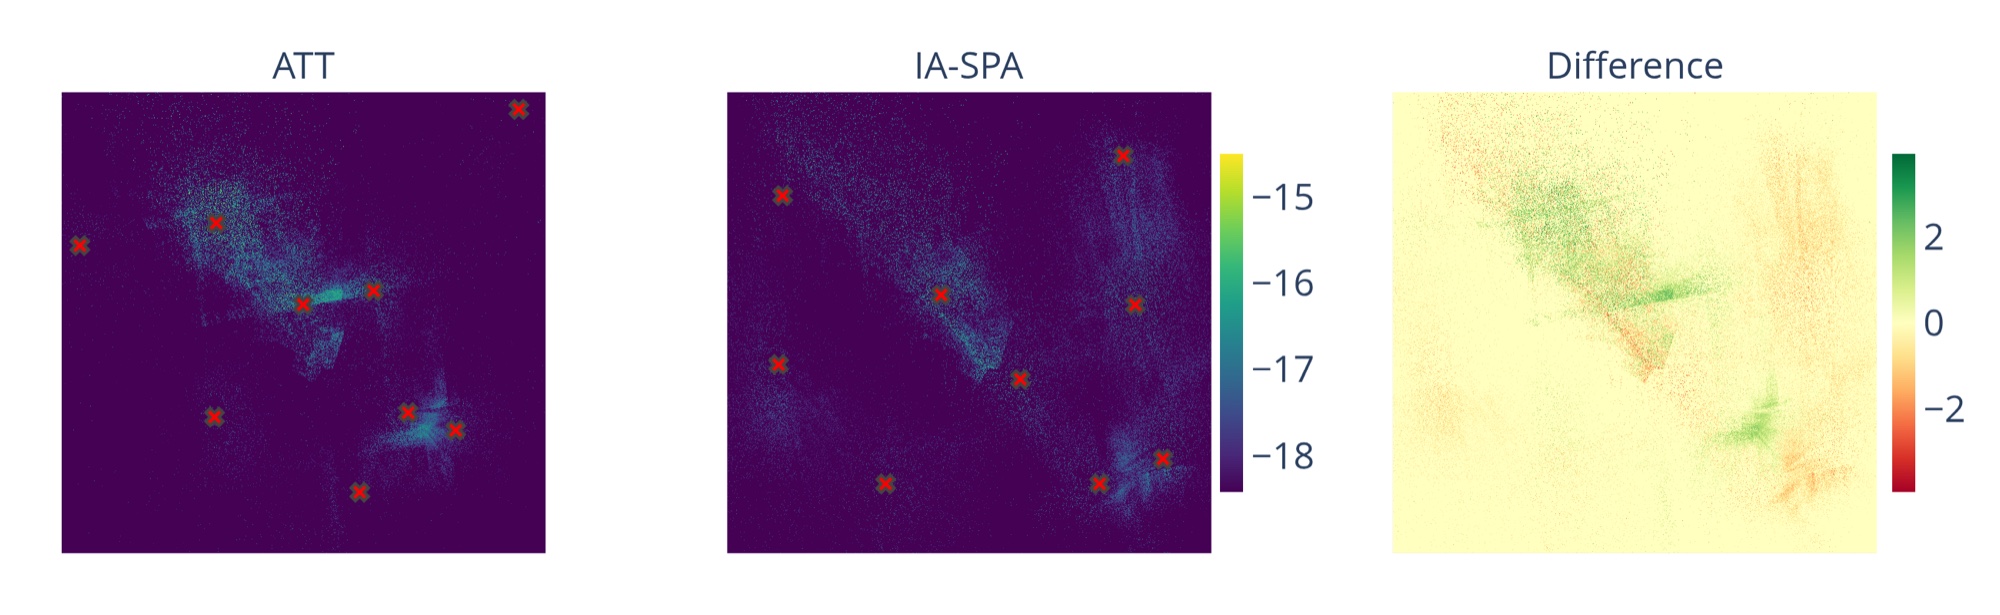
Interference across San Francisco for the same two deployments (AT&T left, IA-SPA center, difference right).
In historic city centers, towers often cannot go everywhere: real-estate availability, permitting, and heritage protection rule out some sites. In Florence we compare IA-SPA with the existing network of the carrier Iliad (33 transmitters) while prohibiting new towers inside exclusion zones. Candidate sites inside a zone are simply removed from \(\mathcal{X}\); the propagation model is unchanged, and IA-SPA uses the same number of transmitters (33).
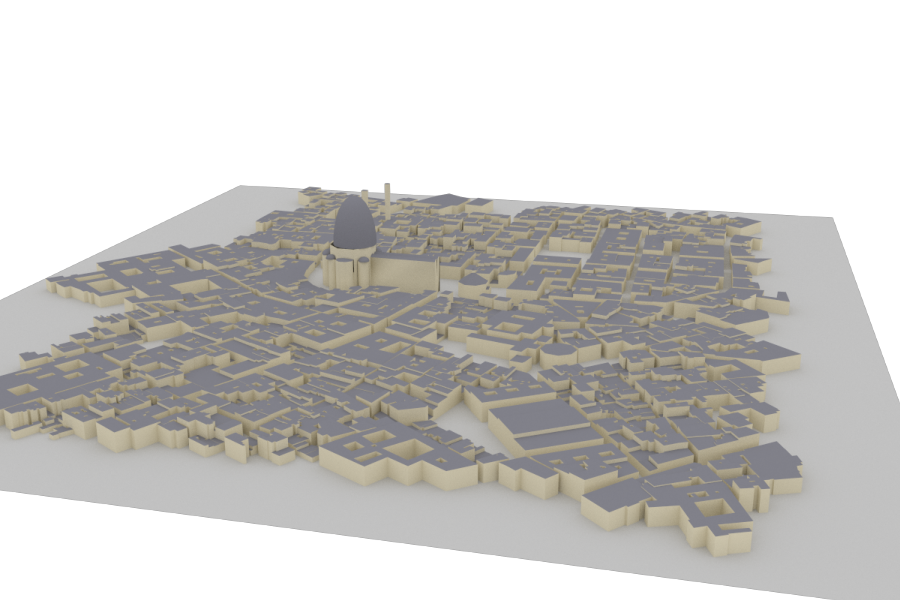
High-fidelity 3D model of Florence used for ray-tracing simulations.
We test two levels of restriction: a single zone around the Basilica di San Lorenzo and its piazza, and then three separate zones, adding one to the northwest and one to the south. None of Iliad's existing sites falls inside the two additional zones, so the reference network is the same in both tests.
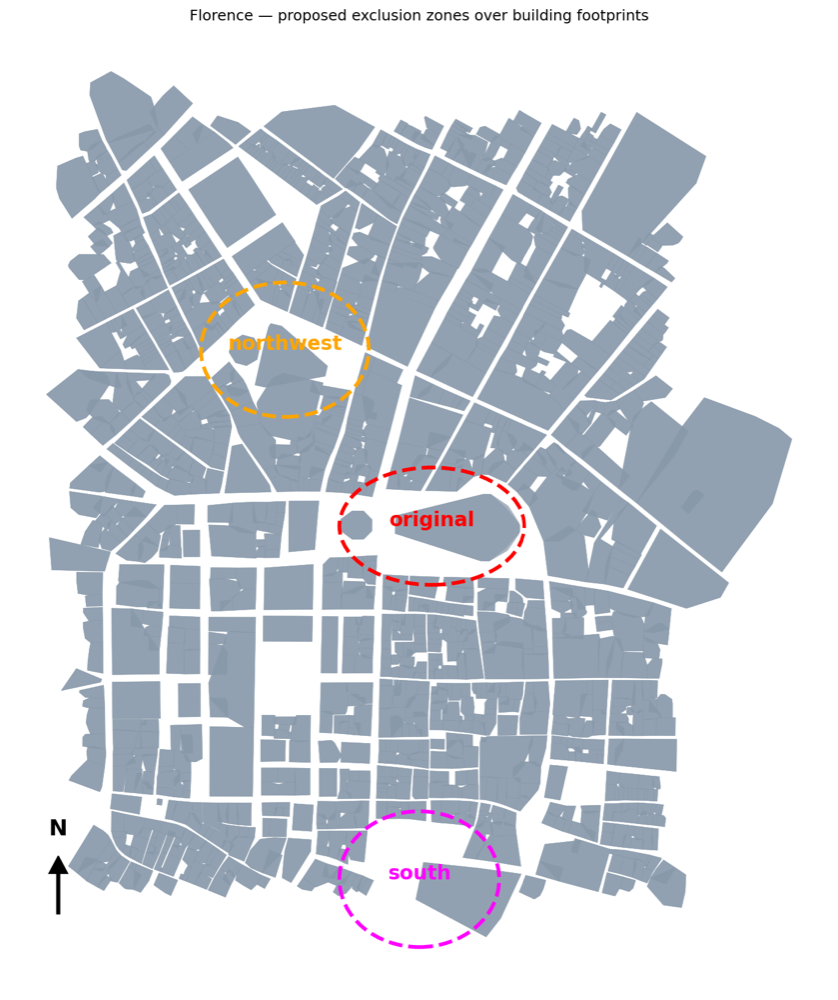
The three exclusion zones over Florence's building footprints: the original San Lorenzo zone (red) and the additional northwest (orange) and south (magenta) zones.
| One zone (San Lorenzo) | Three zones | |||||
|---|---|---|---|---|---|---|
| Metric | Iliad | IA-SPA | Change | Iliad | IA-SPA | Change |
| Data Rate [Mbps] | ||||||
| Mean Rate | 39.21 | 50.96 | +30.0% | 39.15 | 49.77 | +27.1% |
| Edge Rate (5th pct.) | 7.41 | 11.53 | +55.6% | 7.43 | 11.21 | +50.9% |
| Interference [nW] | ||||||
| Mean Interference | 85.44 | 59.40 | −30.5% | 88.10 | 63.12 | −28.3% |
| Max Interference | 4998.62 | 2490.50 | −50.2% | 5064.36 | 1858.59 | −63.3% |
Adding two more zones costs surprisingly little: the mean-rate gain over Iliad drops only from about 30% to 27%, and the edge-rate gain from about 56% to 51%.
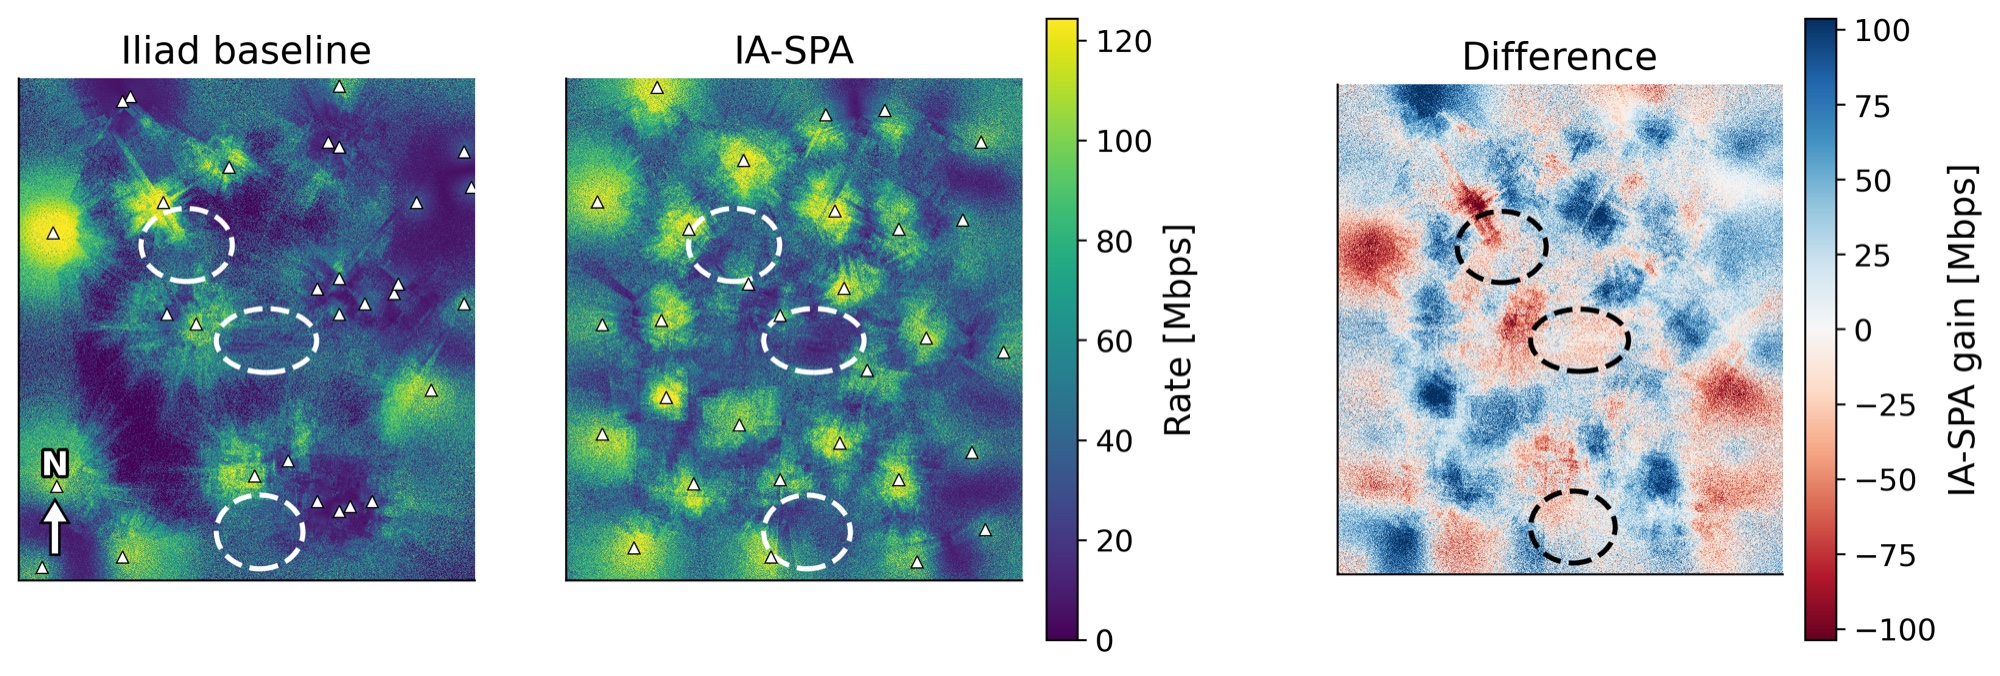
Data rate across Florence with three exclusion zones (dashed ellipses): Iliad reference deployment (left), IA-SPA deployment (center), and the gain from IA-SPA (right). Triangles mark transmitter locations.
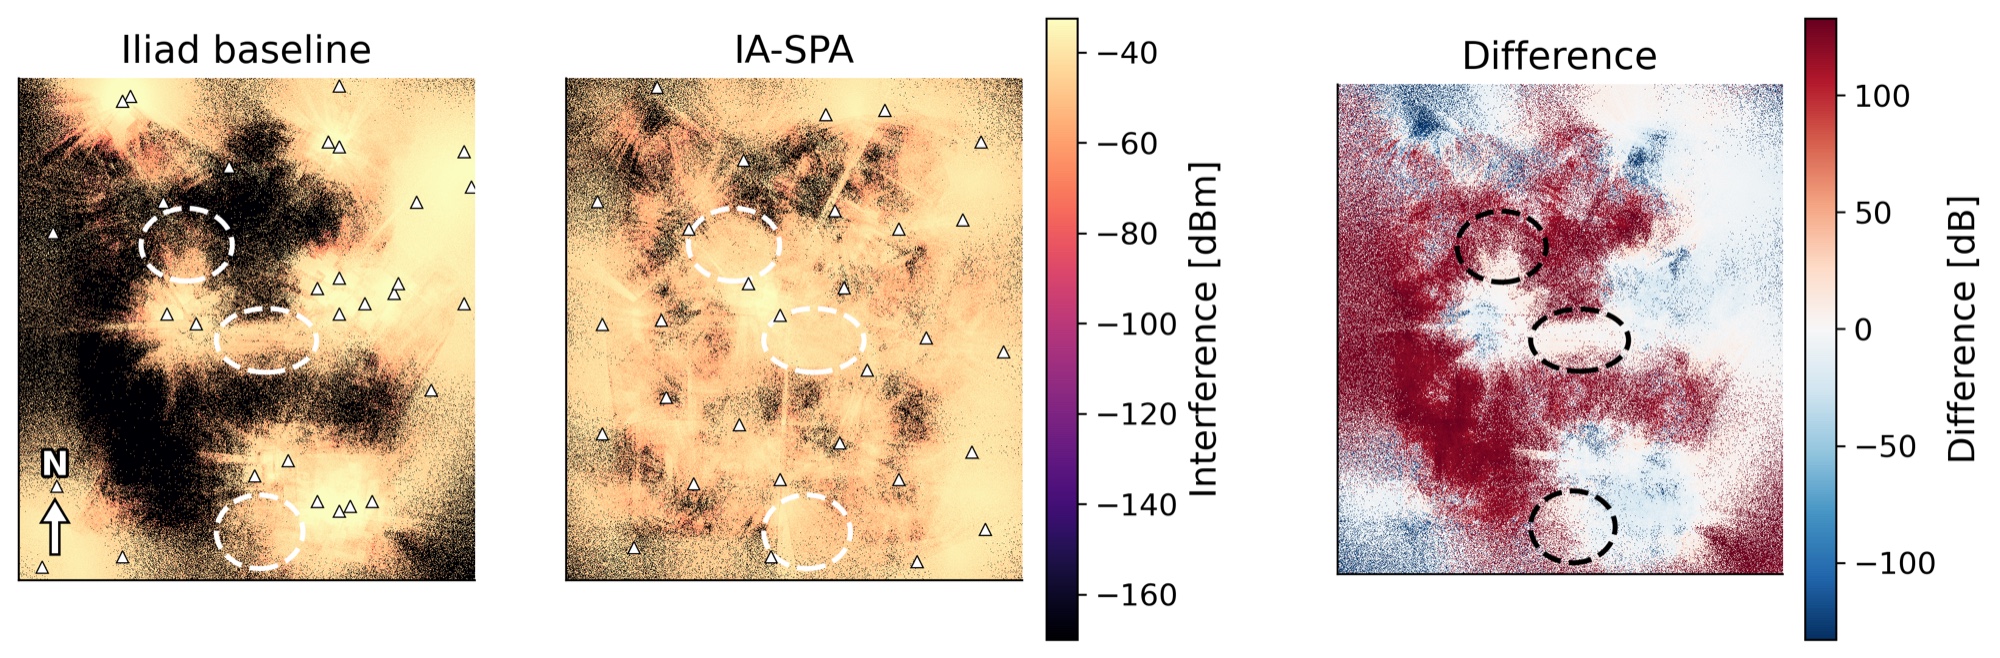
Interference across Florence for the same two deployments (Iliad left, IA-SPA center, difference in dB right).
A placement is only useful if its advantage survives the gap between the model and the real city. Keeping both the IA-SPA and AT&T tower locations fixed, we re-evaluated them in thirteen perturbed versions of San Francisco: the conductivity or the permittivity of all surfaces scaled, one at a time, by −25%, −10%, +10%, or +25% (eight cases); 300 street-level "vehicles" added at random (three draws); and one central building removed or a new one added (two cases). Across all of them, IA-SPA's mean-rate advantage over AT&T stays between 66.7% and 71.7% (70.4% nominally), and its edge-rate advantage between 62.3% and 92.4% (88.0% nominally).
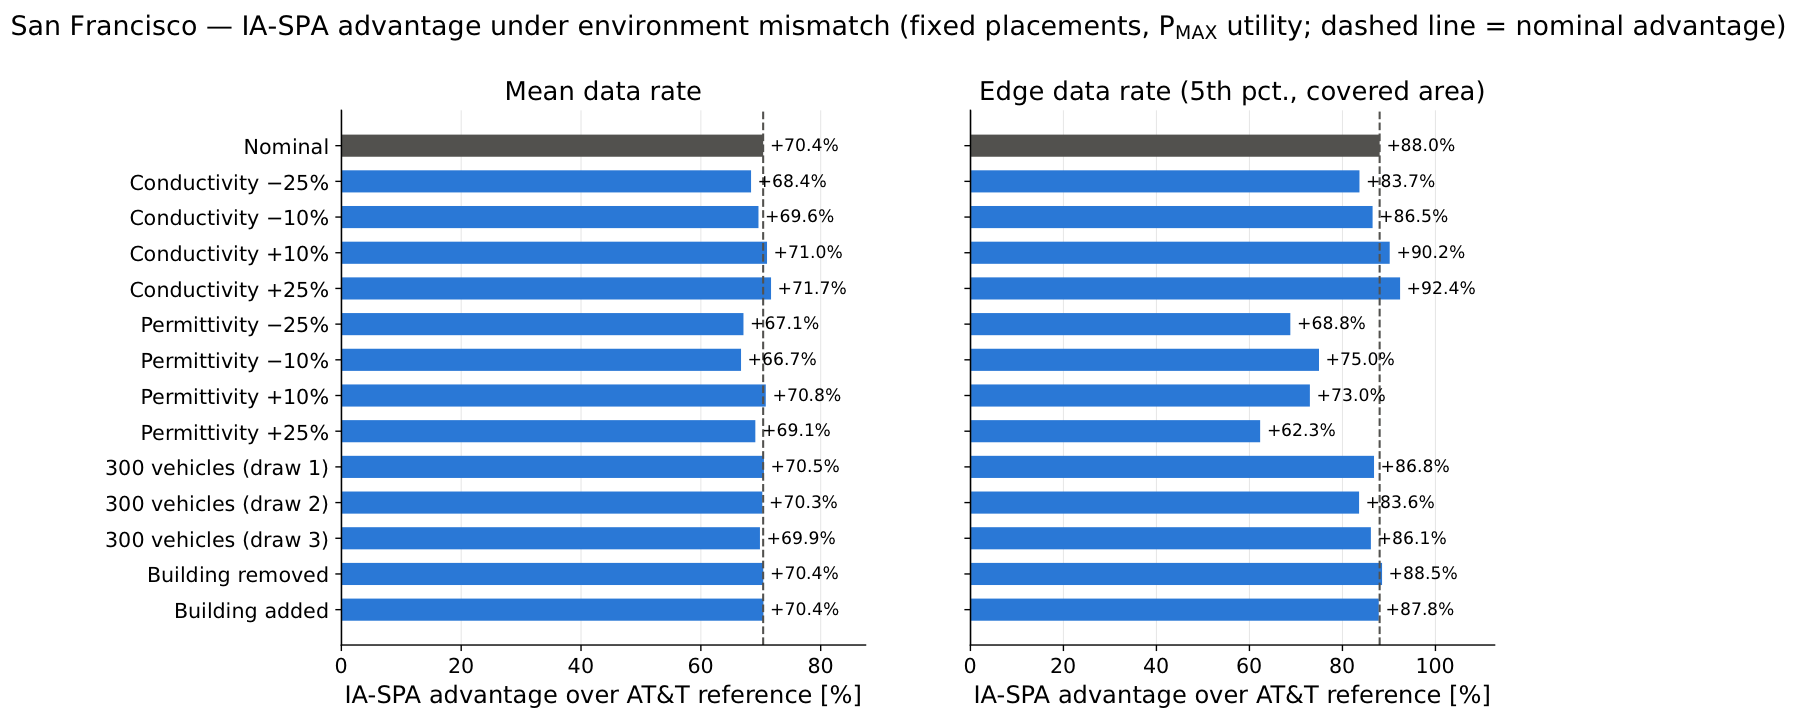
IA-SPA's advantage over the AT&T deployment in mean data rate (left) and edge rate (right) when the environment differs from the one used for optimization. The dashed line marks the nominal advantage.
The advantage also persists under small-scale fading. In the most severe case tested (Rayleigh fading with diversity order \(L = 1\)), IA-SPA's edge rate remains about 81% higher than AT&T's, compared with 88% without fading.
In practice, operators rarely build a network from scratch; they add transmitters to one that already exists. We test this by starting from substantial existing networks and adding just three towers, chosen either by IA-SPA or at random (averaged over 10 random trials): in San Francisco, the combined 16-tower network of AT&T (9) and T-Mobile (7); in Florence, Iliad's 33-tower network.
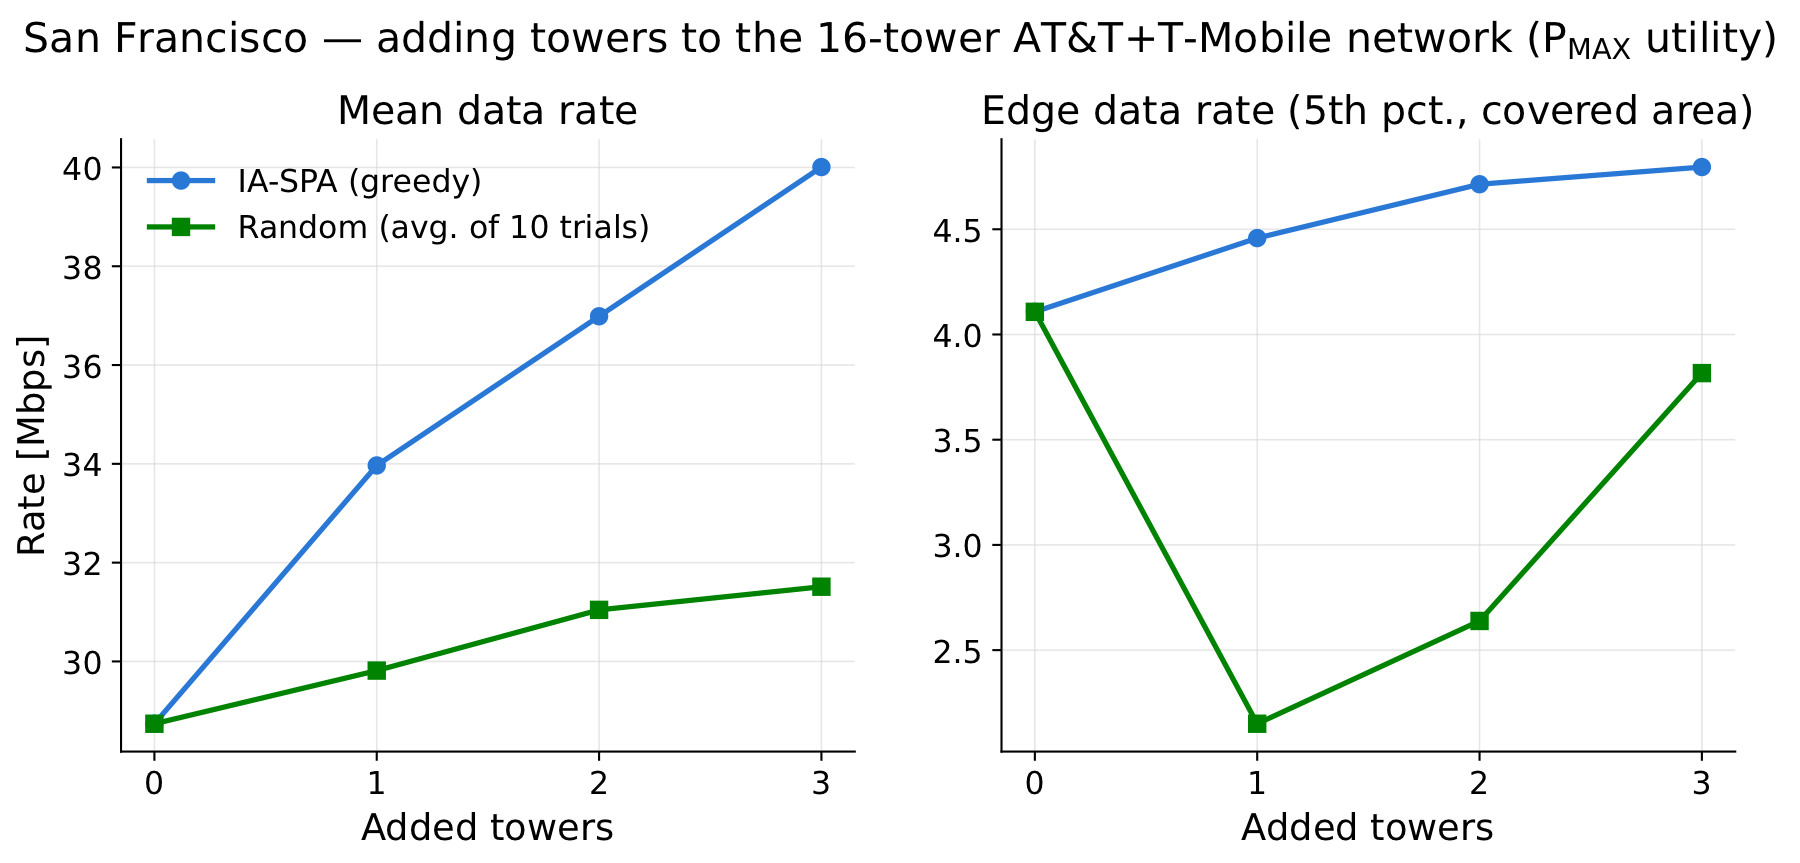
San Francisco: mean data rate (left) and edge rate (right) as towers are added to the existing 16-tower AT&T + T-Mobile network.
In San Francisco, both strategies start from a mean rate of about 28.7 Mbps. After three additions, IA-SPA reaches 40.0 Mbps, versus 31.5 Mbps for random placement (27% higher), and its edge rate is 26% higher. Random placement actually lowers the edge rate after the first added tower before partly recovering, while IA-SPA raises it with every addition: adding towers indiscriminately to an interference-limited network can hurt the worst-served users.
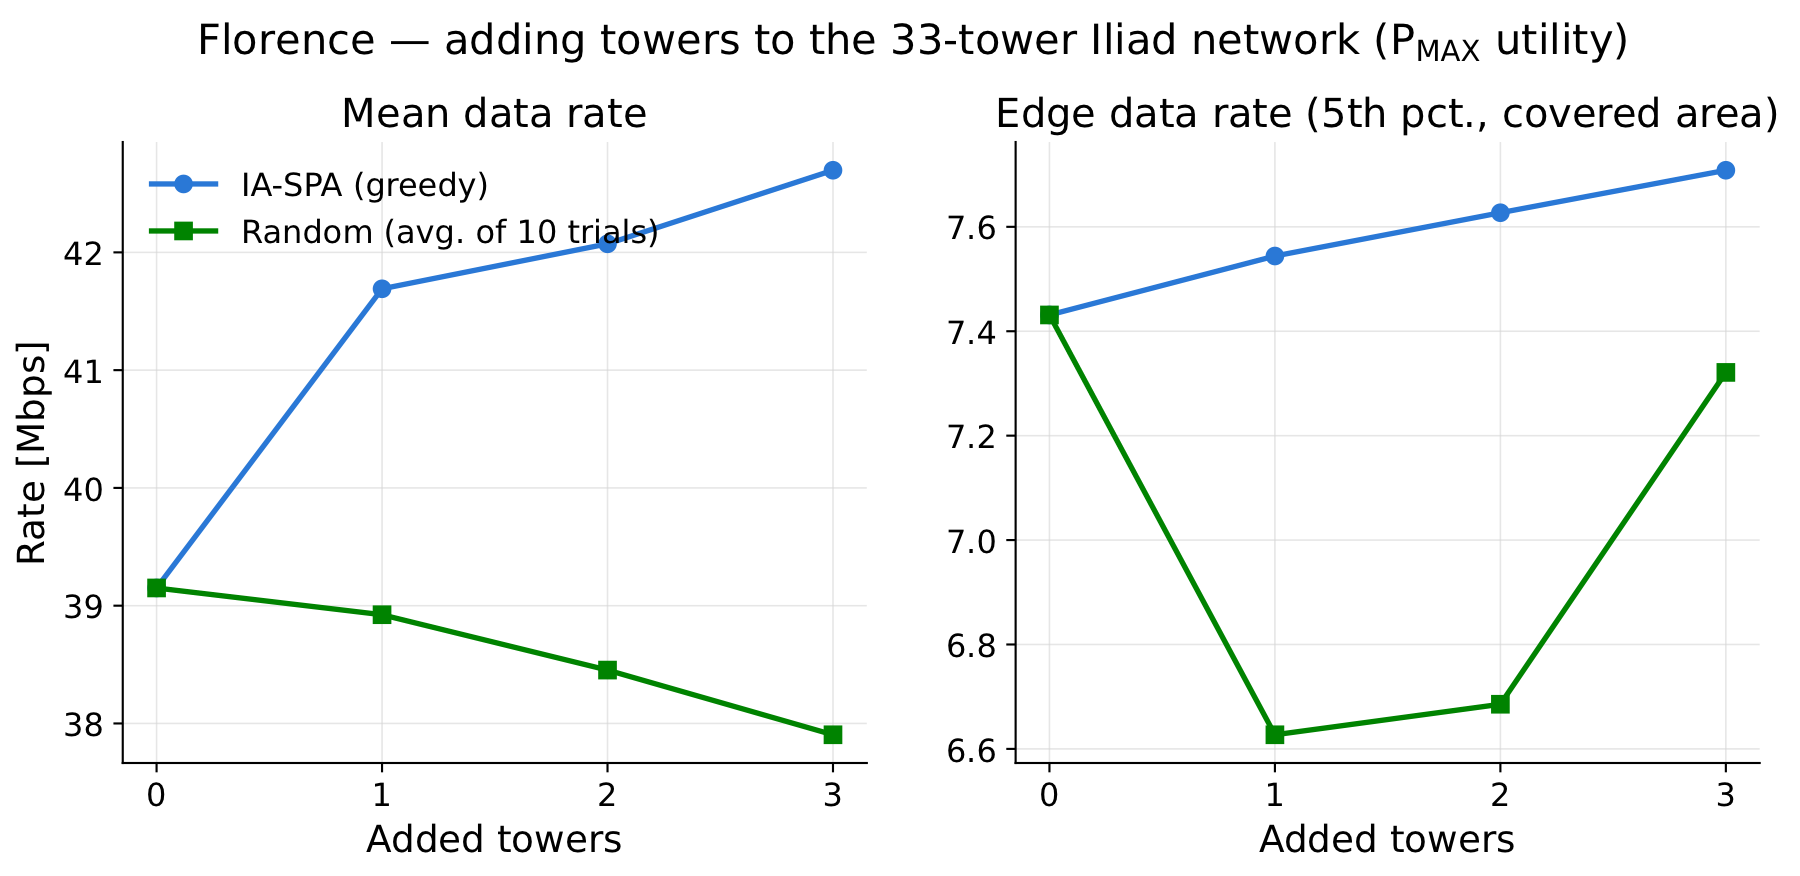
Florence: mean data rate (left) and edge rate (right) as towers are added to the existing 33-tower Iliad network.
Florence starts from a much denser network. There, random additions reduce the mean rate, from about 39.2 to 37.9 Mbps, consistent with indiscriminate densification adding interference without a matching gain in coverage. IA-SPA instead raises it to 42.7 Mbps, 12.7% above random placement, with about 9% lower mean interference and a modestly higher edge rate (+5%).